

- 2026-10-04
- by LethaldiranMX
- Trends
- 0 Comments

LethaldiranMX Insight
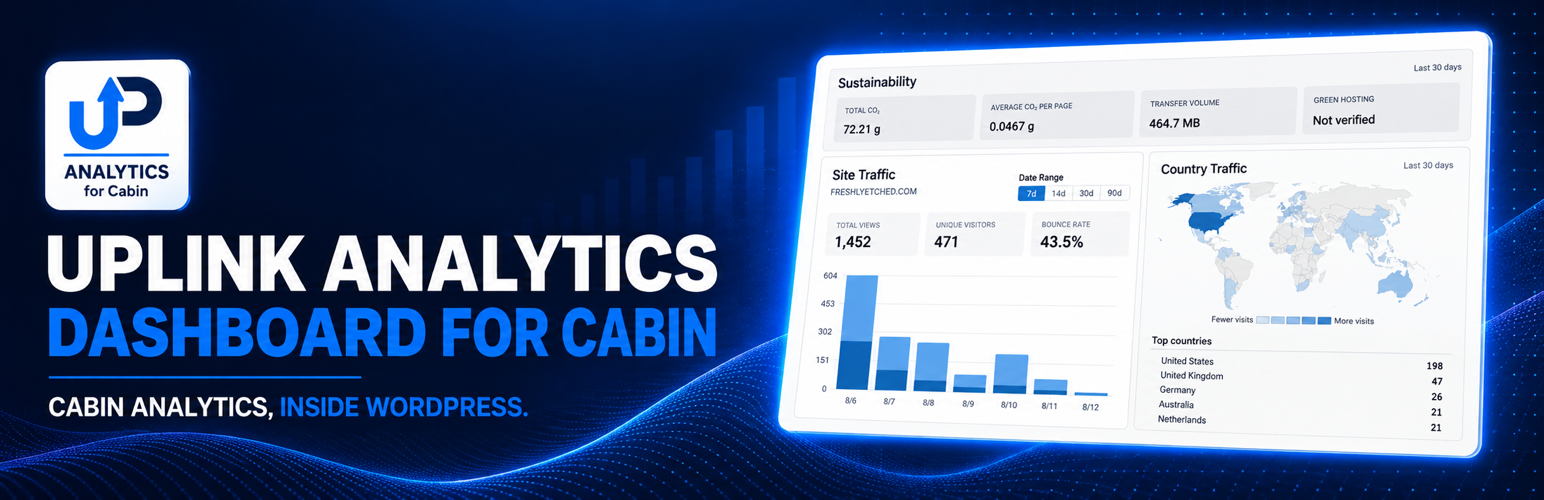
The Uplink Analytics Dashboard for Cabin bridges the gap between privacy-first web analytics and native WordPress administration by embedding Cabin’s lightweight tracking metrics directly into the block editor and dashboard. By reconciling raw API path data with local WordPress post types and permalinks, it transforms abstract traffic logs into actionable, context-rich content performance insights. This integration allows publishers and digital operations teams to monitor sustainability metrics, geographic distribution, and referral sources without leaving the WordPress admin interface. It serves as a highly functional bridge for teams looking to maintain strict user privacy while retaining robust, localized reporting.
Best Fit & Operational Role: This plugin is an ideal fit for privacy-conscious organizations, content publishers, and agency developers who have migrated to Cabin Analytics PRO and want to democratize traffic data for their editorial teams. By providing Gutenberg blocks and shortcodes with live editor previews, it allows site builders to easily construct public-facing popular content lists or internal reporting dashboards. It solves the operational challenge of fragmented reporting by consolidating traffic, sustainability, and demographic data directly within the WordPress ecosystem, eliminating the need for client-side tracking scripts or external dashboard logins for content editors.
Potential Limitations & Pitfalls: To utilize this plugin, an active Cabin PRO account is strictly required to access the necessary API endpoints, which introduces an external service dependency. From an operational standpoint, the dynamic reconciliation of Cabin page paths to local WordPress post IDs relies on API performance and database queries, which could introduce minor overhead on high-traffic public-facing pages if shortcodes are not cached properly. Additionally, because this is an independent integration by UplinkPress, future updates to Cabin’s API structure could potentially disrupt data rendering if the plugin is not maintained in lockstep with upstream API changes.

Display Cabin Analytics charts, dashboard widgets, shortcodes, and popular content lists in WordPress.
Uplink Analytics Dashboard for Cabin integrates Cabin Analytics into your WordPress site. It provides dashboard widgets, Gutenberg blocks, shortcodes, and popular content output powered by the Cabin Analytics API.
This is an independent UplinkPress plugin. It is not affiliated with, endorsed by, or an official product of Cabin. Learn more about the plugin at uplink.press.
The Cabin Analytics API is available to Cabin PRO accounts.
Features:
- Dashboard widget for viewing analytics in WordPress admin
- Responsive Cabin Dashboard for authorized WordPress users
- Polished standalone Uplink Popular Content for Cabin dashboard widget with title, domain, controls, and summary/detail metrics
- Separate Sustainability, Demographics, and Sources dashboard widgets
- Per-module visibility controls for dashboard reports, blocks, and shortcodes
- Uplink Site Traffic for Cabin block for analytics charts
- Gutenberg block for Popular Content with the same interactive controls and expandable metrics as the Dashboard widget
- Gutenberg blocks for Sustainability, Demographics, and Sources
- Privacy-friendly Country Traffic Map block with an independent date range and accessible country values
- Live data previews for every Cabin block in the WordPress editor
- Editable headings for every analytics block, with clear report-specific defaults
- Shortcode support for analytics charts
- Popular Content shortcode
- Sustainability, Demographics, Sources, and Country Traffic Map shortcodes
- Reconciles Cabin page paths to local WordPress public post types
- Configurable popular content title, quantity, and date range for shortcode and block output
- Popular Content date range setting for shortcode, block, and dashboard widget
- Interactive stacked bar and line charts showing page views and unique visitors
- Configurable date ranges
- Global settings for API key, default domain, chart options, and popular content defaults
- Responsive front-end output
Popular Content:
The Popular Content feature retrieves top pages from Cabin Analytics and attempts to match each path to a local WordPress post, page, or public custom post type. Matching content uses the local WordPress title and permalink. If a Cabin path does not exist on the current WordPress installation, the plugin displays a readable path title linked to the configured Cabin domain instead.
Default shortcode:
[uplianda_popular_content]
With custom options:
[uplianda_popular_content qty="10" date_range="30" title="Top Content"]
Parameters:
qty– Number of posts to display:5,10,20, or50date_range–1,7,14,30, or90title– Optional heading text
If no shortcode title or date range is provided, the plugin uses the values configured in Cabin Dashboard Settings.
Dashboard Popular Content:
Popular Content is available as a standalone WordPress dashboard widget titled “Uplink Popular Content for Cabin” when WP dashboard widgets are enabled in Cabin Dashboard Settings. It can be hidden, shown, and moved using the standard WordPress Dashboard Screen Options. Disabling WP dashboard widgets unregisters all five Cabin widgets, so they no longer appear in Screen Options. The widget, block, and shortcode share the same presentation: title and domain, date range controls, quantity controls for 5, 10, 20, or 50 items, and summary/detail entries with page views, unique visitors, and Attention. Attention uses Cabin’s approximate duration style, such as ~52s or ~2m. Per-page CO₂ is displayed only when Cabin returns a positive value.
Sustainability, Demographics, and Sources:
The WordPress dashboard provides three movable widgets so each report stays compact:
- Sustainability displays available total and average CO₂, transfer volume, and green-hosting status.
- Demographics displays device mix, countries, languages, and browsers.
- Sources displays traffic sources and top referrers.
Each report also has a dynamic Block API v3 block and shortcode. Adding one to public content is the site owner’s explicit choice to publish that Cabin data. The dashboard REST route remains limited to logged-in users who can edit posts.
Shortcodes:
[uplianda_sustainability date_range="30" title="Sustainability"]
[uplianda_demographics date_range="30" title="Demographics"]
[uplianda_sources date_range="30" title="Sources"]
Supported reporting periods are 7, 14, 30, and 90 days.
Every module is enabled by default. Set a shortcode module to false to hide it:
[uplianda_sustainability total_co2="true" average_co2="false" transfer_volume="true" green_hosting="true"]
[uplianda_demographics devices="true" countries="true" languages="false" browsers="false"]
[uplianda_sources traffic_sources="true" referrers="false"]
The equivalent block settings are available in the block sidebar. Every block also provides a Heading field. Defaults are Site Traffic, Top Content, Sustainability, Demographics, Sources, and Country Traffic. Dashboard-widget modules are configured under Cabin Dashboard Settings.
Country Traffic Map:
The Uplink Country Traffic Map for Cabin block plots Cabin’s aggregated country totals on a responsive world choropleth. Each block has its own 7, 14, 30, or 90 day reporting period. Pointer hover reveals a country tooltip. Keyboard users can Tab to the map once and move through countries in descending traffic order with the arrow keys; Home and End jump to the first and last country. A ranked list and expandable table provide the exact values without relying on color or the map graphic.
The map is rendered locally from bundled Natural Earth public-domain geometry. It does not use Google Maps, map tiles, geocoding, external map scripts, browser location, cookies, or visitor-level data. Only the server-side Cabin API request described under External Services is made.
Shortcode:
[uplianda_country_map date_range="30" title="Traffic by Country"]
Cabin Dashboard:
Uplink Dashboard for Cabin adds a backend-only analytics page to the WordPress admin menu. It presents the Cabin API data in a focused report with section navigation, selectable reporting periods, and light or dark mode. Access is controlled by role from the plugin settings.
The dashboard uses a purpose-built, responsive report layout inspired by Cabin’s public analytics experience. A side rail keeps long reports navigable on larger screens, reporting periods are available in the header, and the local light/dark preference follows the user between visits. The page uses bundled fonts and makes no external font request.
Each Cabin report block keeps its own date range and module choices. For example, add four Demographics blocks in different locations and configure them separately for devices, countries, languages, and browsers.
Administrators have access by default and always retain access. Additional WordPress roles can be authorized under Cabin Dashboard Settings Cabin Dashboard.
The Cabin Dashboard is always available to authorized roles. Clear Enable WP dashboard widgets to unregister the five widgets from the standard WordPress Dashboard without changing the Cabin Dashboard, blocks, or shortcodes.
Chart Shortcode:
Basic usage:
[uplianda]
With custom parameters:
[uplianda title="Site Traffic" domain="example.com" chart_type="line" date_range="30" allow_switching="true"]
Parameters:
domain– Override default domaintitle– Optional heading; defaults toSite Trafficchart_type–barorlinedate_range–7,14,30, or90allow_switching–trueorfalse
wp-config.php Defaults
Site owners can define defaults in wp-config.php. Constants take precedence over values saved in the WordPress admin.
define( 'UPLIANDA_API_KEY', 'your-api-key' );
define( 'UPLIANDA_DOMAIN', 'example.com' );
define( 'UPLIANDA_DEFAULT_CHART_TYPE', 'bar' );
define( 'UPLIANDA_DEFAULT_DATE_RANGE', '7' );
define( 'UPLIANDA_DASHBOARD_URL', 'https://withcabin.com' );
define( 'UPLIANDA_POPULAR_CONTENT_TITLE', 'Top Content' );
define( 'UPLIANDA_POPULAR_CONTENT_DATE_RANGE', '30' );
define( 'UPLIANDA_DASHBOARD_WIDGETS_ENABLED', true );
Dashboard module defaults can also be locked with boolean constants. Available suffixes are:
UPLIANDA_DASHBOARD_SUSTAINABILITY_TOTAL_CO2UPLIANDA_DASHBOARD_SUSTAINABILITY_AVERAGE_CO2UPLIANDA_DASHBOARD_SUSTAINABILITY_TRANSFER_VOLUMEUPLIANDA_DASHBOARD_SUSTAINABILITY_GREEN_HOSTINGUPLIANDA_DASHBOARD_DEMOGRAPHICS_DEVICESUPLIANDA_DASHBOARD_DEMOGRAPHICS_COUNTRIESUPLIANDA_DASHBOARD_DEMOGRAPHICS_LANGUAGESUPLIANDA_DASHBOARD_DEMOGRAPHICS_BROWSERSUPLIANDA_DASHBOARD_SOURCES_TRAFFIC_SOURCESUPLIANDA_DASHBOARD_SOURCES_REFERRERS
For example: define( 'UPLIANDA_DASHBOARD_DEMOGRAPHICS_BROWSERS', false );
External Services
This plugin connects to the Cabin Analytics API at https://api.withcabin.com/v1/analytics to retrieve analytics data. It sends the configured domain, requested date range, requested data scope, list limit, and the administrator-provided API key. Requests occur when an analytics chart, Popular Content display, dashboard insight widget, Country Traffic Map, or public insight block or shortcode needs uncached data. Responses are cached temporarily in WordPress.
Cabin is a third-party service. This independent UplinkPress plugin is not affiliated with or endorsed by Cabin. A Cabin PRO account and API key are required. Review Cabin before use.
The Country Traffic Map includes simplified geographic shapes generated at build time from Natural Earth, whose map data is in the public domain. No request is made to Natural Earth or any other map provider when the plugin runs.
Editorial note: This overview combines WordPress.org official plugin metadata with an AI-assisted LethaldiranMX editorial review. Plugin data should be verified on the official WordPress.org listing before installation.